
Statistical Rings and Dispersion Angles
Based on the International Search & Rescue Incident Database (ISRID) and the book Lost Person Behaviour by Robert Koester, SARTrack can now display a Statistical Ring system, including (optional) Dispersion lines.
Also
optional is a 'Travel Circle' which shows an expanding circle based on
estimated speed since Last Seen (not shown on this example).
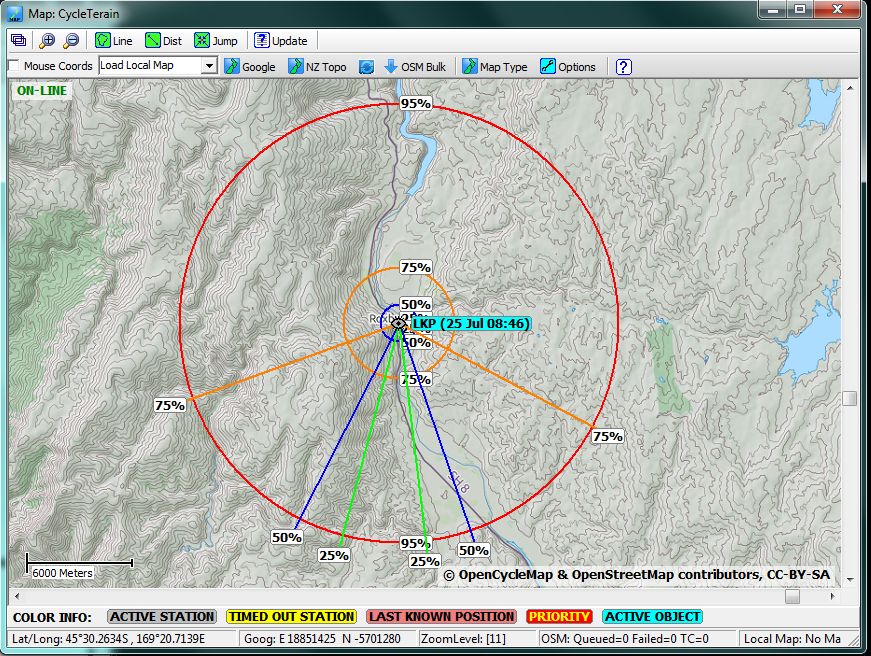
You start by selecting the location on the Map, then right-click and select Add IPP/LKP Circles.
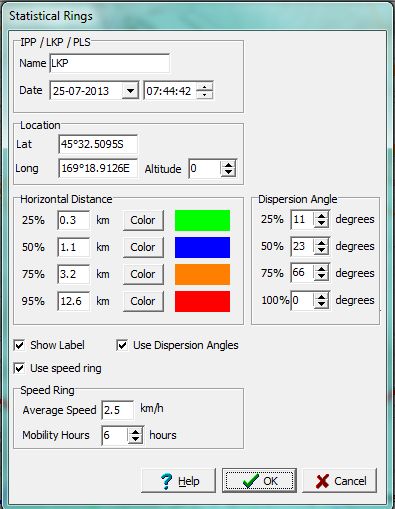
- Enter a short Name for the location (is it a LKP or a PLS?)
-
Enter the Date and Time of the person's Point Last Seen. (Note: If you
are going to use the Travel Circle, this date MUST be the date of
the PLS)
- Set the Altitude if required.
- Enter the 25%,
50%, 75% and 95% values from the book "Lost Person Behaviour". In the
example above, the values for Dementia (Alzheimer’s) are used.
Any fields left to 0.0, will not be rendered on the Map.
- If you
decide to use the Dispersion Angles, tick the box, then enter the
values from the book. Any fields left at 0 will not be rendered on the
Map.
The Travel Ring is a special ring on the Map, which grows
with time, depending on the 'Average Speed' set, and the Date and
Time.
NOTE: This is not part of the ISRID system, but may be usefull in certain situations.
You can only use the 'Travel Ring or 'Speed ring', if you have a valid Point Last Seen for the missing person.
Enter
a 'Average Speed' for the person, which is fully at the discretion of
the Operations Manager, who will have to calculate a reasonable speed
in for the given situation and terrain.
You can then enter the
'Mobility Hours' from the book, or another value, indicating after how
many hours the expectation of the missing person still moving will no
longer be valid. After that time, the Travel Circle will disappear from
the Map.
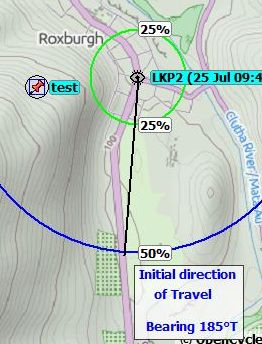 If you are using the Dispersion Lines, after you click OK, you will be able to set the 'Initial Direction Of Travel'.
In the example below, the Travel Circle is the thick red circle.
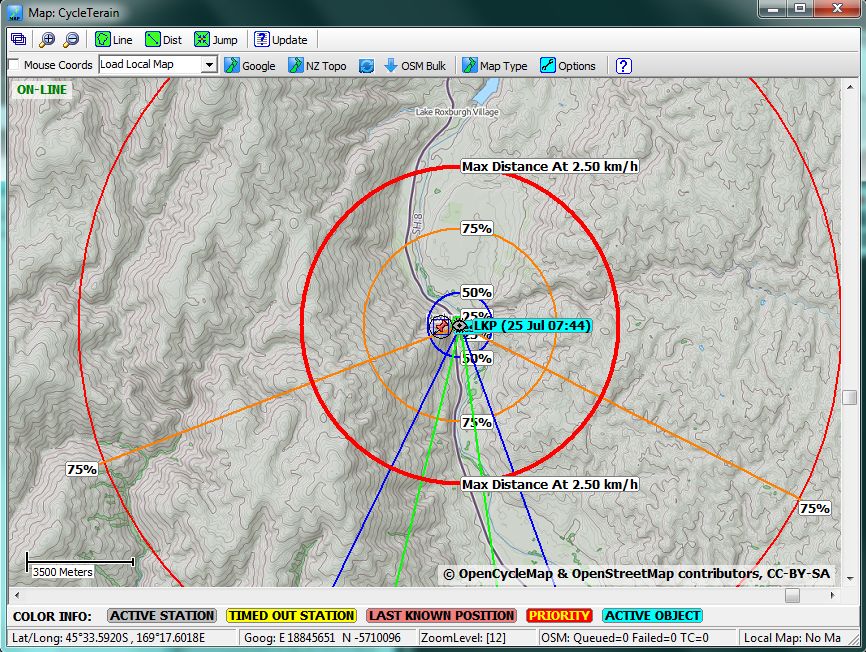
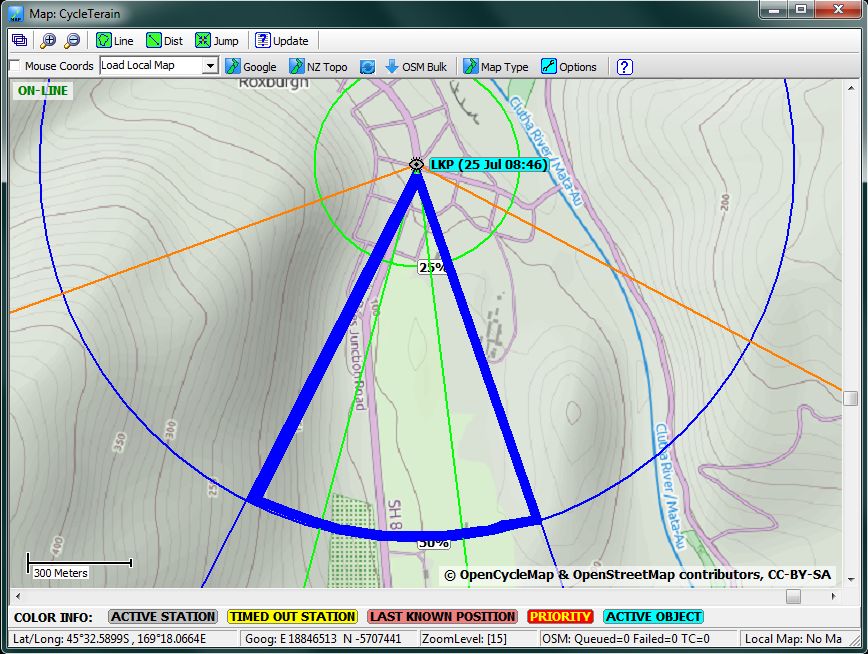
The Colors of the percentage circles are linked to the colors of the percentage Dispersion Lines.
This
means that the 'Pie' shape produced by lines of the same color, are the
statistical percentage chance for the person to be in that area. See
the highlighted example below.
- The Statistical Ring system can be edited at any time.
- You can hide all Labels.
-
You can hide the entire Statistical Ring system, and (for example)
start a new one, if you receive a new PLS information. The original
system will still be available to display when needed, or during
debrief (Its in the Objects window).
- The system will be transmitted over the APRS network, and will be on the Maps of all connected SARTrack computers.
26 July 2013,
Bart Kindt
CEO, SARTrack developer


 If you are using the Dispersion Lines, after you click OK, you will be able to set the 'Initial Direction Of Travel'.
